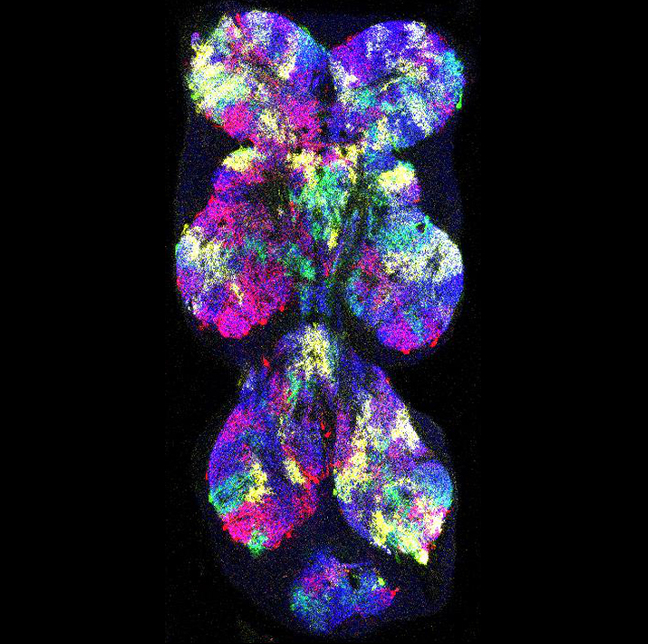
NEW YORK – Recently, scientists have discovered the spinal cord’s cellular diversity is much greater and more complex than previously thought. To explore the circuitry and properties of spinal neurons in context, Columbia researchers have developed a way, for the first time, to map the full spinal cord of mice in 3-D.
The new tools and techniques will support investigations into the arrangements, identities and functions of the nerve cells that connect the brain to the rest of the body. Such work could advance research into everything from understanding the coordination of movements and the experiences of touch and pain, to promoting regeneration and healing after injury and in disease.
Described online September 15 in Cell Reports Methods, the work outlines tools to process and visualize the whole mouse spinal cord and a novel 3-D atlas, which provides a common framework for work across groups and labs studying spinal circuitry to compare and link their findings.
“The spinal cord is under-studied, compared to the brain, but there has been a surge of interest recently,” said first author on the new paper Felix Fiederling, PhD, a postdoctoral researcher in the Mason-Dodd lab at Columbia’s Zuckerman Institute. “Our tools provide an interactive map of where cells are positioned in relation to each other and how they connect in 3-D space and will help scientists in their work to understand the functional organization of the spinal cord.”
Mapping the Nervous System
Cell atlases in neuroscience have traditionally focused on the brain, where an extraordinary variety of neurons connect to form circuits. Over recent decades, scientists have assembled increasingly complex maps of the locations, nature and functions of these different kinds of neurons to shed light on how the brain works.
The spinal cord, by contrast, was long assumed to be relatively uniform in terms of the general composition of its neurons throughout its length.
That view has been changing recently. Thanks to new techniques for analyzing spinal neurons on a single cell level, researchers have discovered a surprising level of complexity.
Neurons in the spinal cord might look relatively alike. But recent research has revealed spinal neurons possess much higher diversity than previously thought, based on the different genes they switch on and off.
The position of a cell or type of cell dramatically influences what cells it connects to and thus its function.
A Neural GPS
For the Columbia researchers, mapping the locations of different spinal neurons in relation to each other is the first step in deciphering how these cells work together.
"The position of a cell or type of cell dramatically influences what cells it connects to and thus its function," said Carol Mason, PhD, a Zuckerman Institute member and a professor of pathology and cell biology, neuroscience, and ophthalmic science at Columbia’s Vagelos College of Physicians and Surgeons. “That’s why we need a Google Maps for these cells, a GPS of sorts to help us find cells in relation to each other and, eventually, reveal the routes that connect them.”
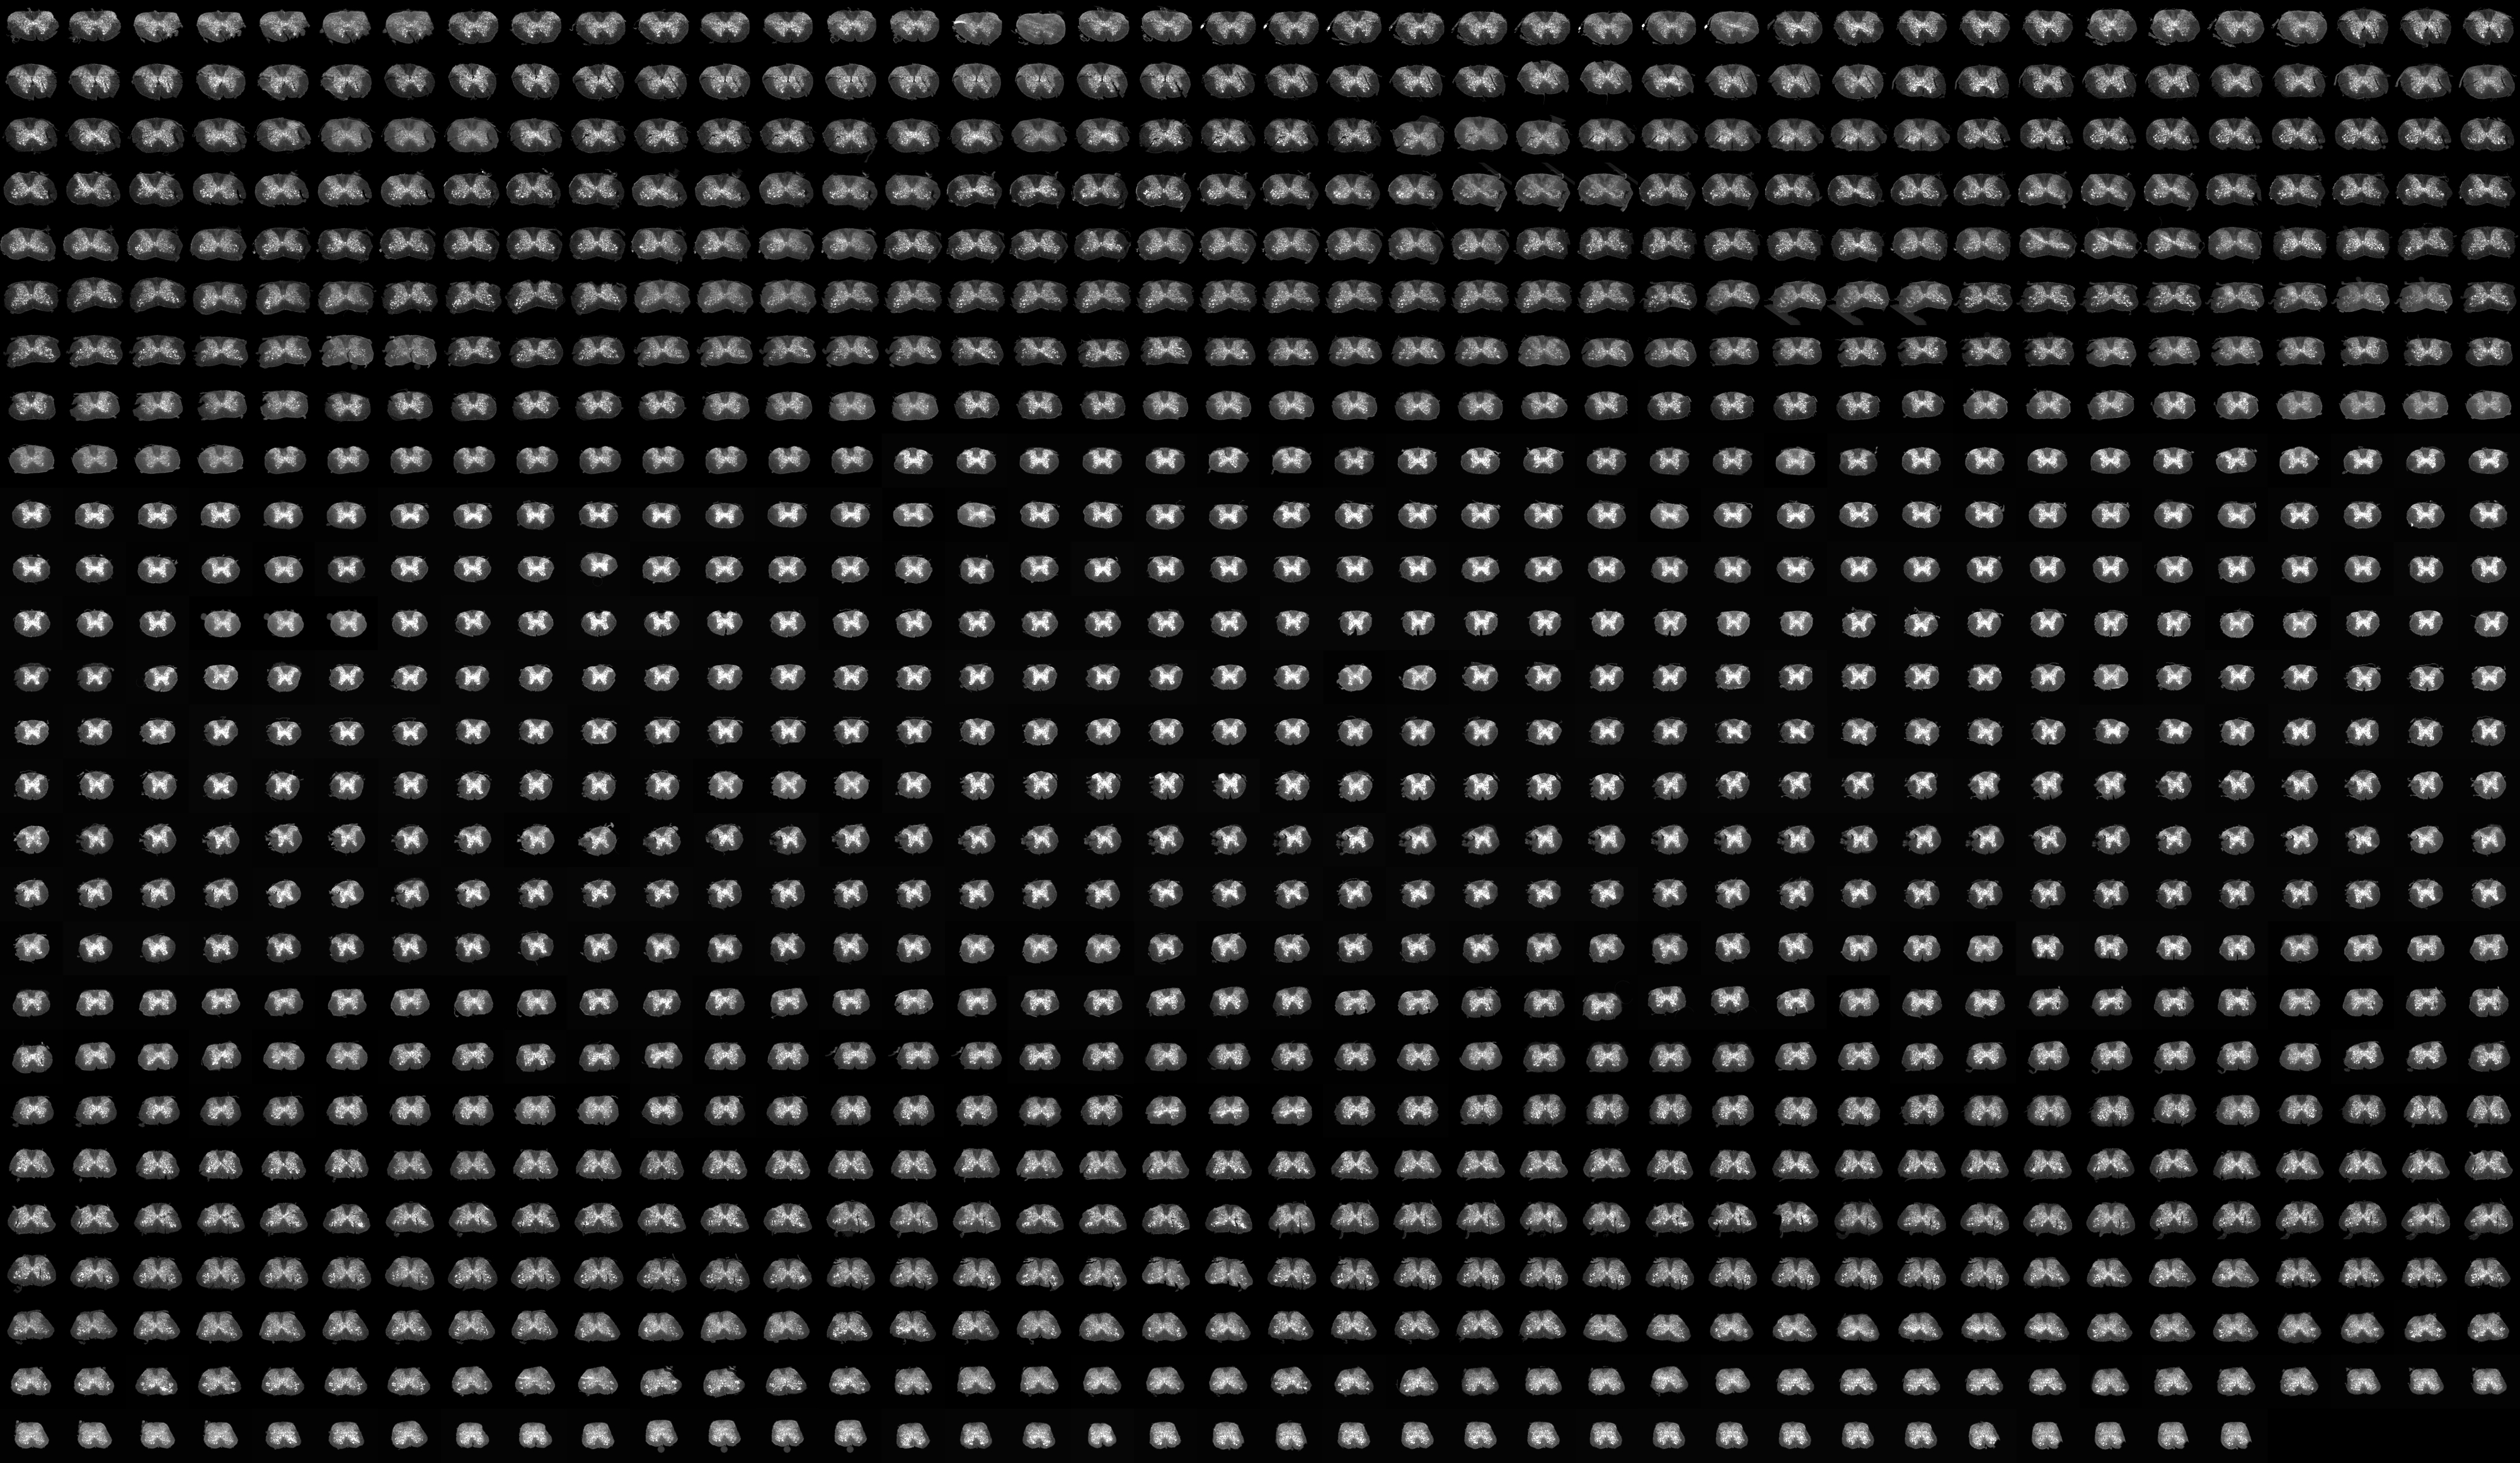
Montage of 1086 sorted and aligned section images of a spinal cord sample (Credit: Felix Fiederling/Mason-Dodd Lab/Columbia's Zuckerman Institute)
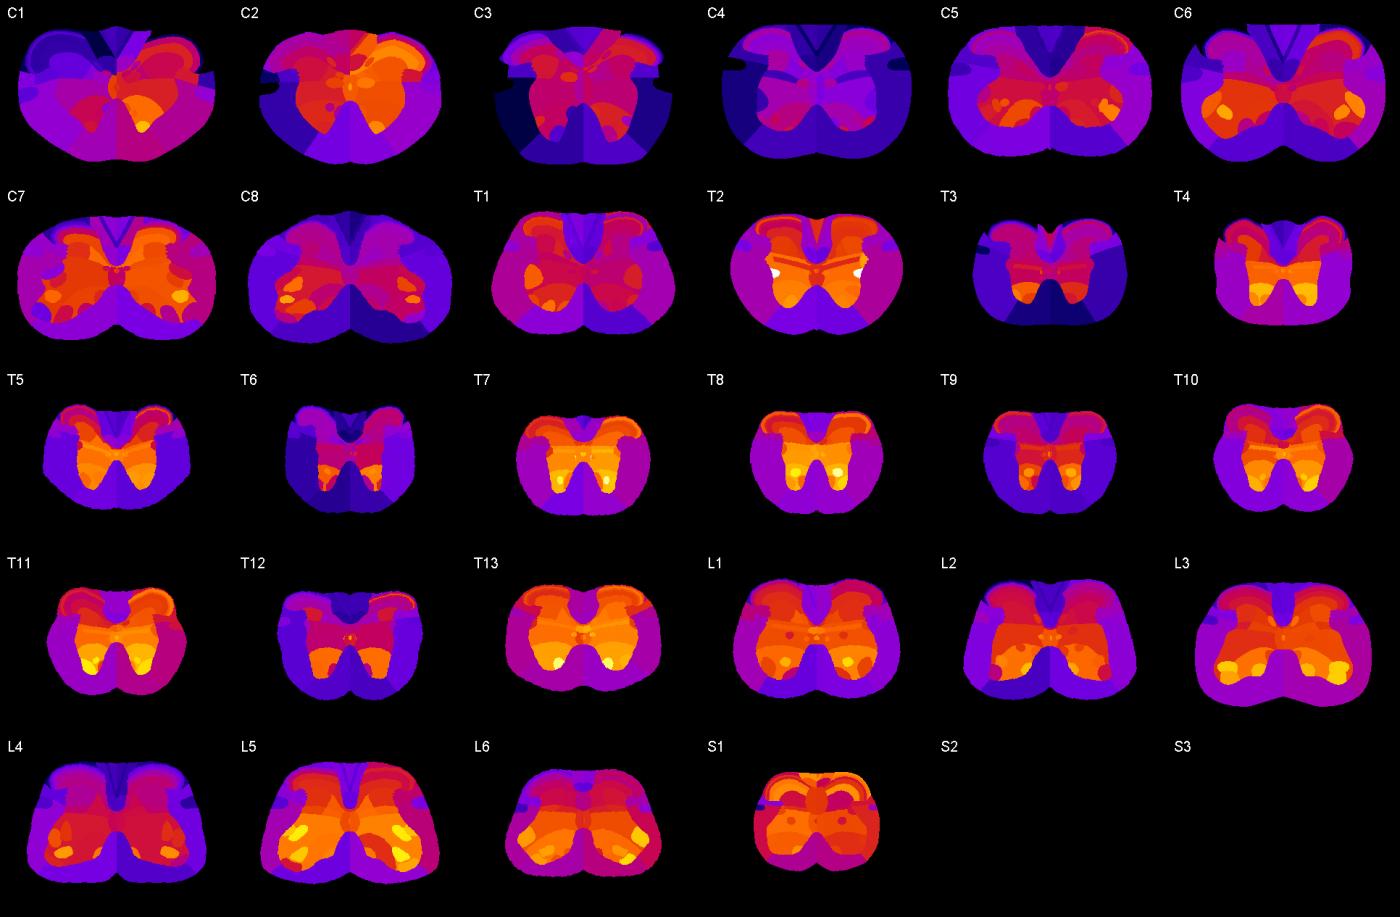
Drs. Fiederling, Mason, senior author Jane Dodd, PhD (a Zuckerman Institute member and professor of physiology & cellular biophysics and neuroscience), and their Zuckerman Institute colleagues, Director of Cellular Imaging Luke Hammond and Director of Genetic Access Tools David Ng, set out to find an efficient way to create a 3-D atlas of the whole adult mouse spinal cord. This started with examining 1,300 cross sections of the spinal cord and keeping them in the right order, a painstaking task using existing methods. However, the researchers found a way to automate and greatly speed this process by developing SpineRacks, 3-D printed supports that hold segments of the spinal cord in ordered position, enabling researchers to process and then visualize multiple cross sections in parallel.
The scientists also developed a computer algorithm, SpinalJ, to organize images of the cross sections, assemble them into a 3-D volume and map them onto a reference spinal cord that includes anatomical annotations the researchers created from data of other labs. The software has achieved a mapping precision of 30 microns, about the diameter of a single neuron.
"This algorithm is flexible enough to accept other people’s data," Dr. Fiederling said. "It provides an open, common framework that should help different labs working on different questions or different parts of the spinal cord to examine and compare their findings.”
Open Source
Other scientists have already started to use this tool, from the Costa lab at Columbia’s Zuckerman Institute, which studies how the brain coordinates complex body movements, to researchers across the United States and Europe studying other topics such as how sensations are processed and how they guide our movements.
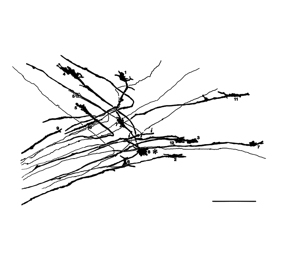
Insights revealed using this atlas can also guide efforts to develop treatments for neurodegenerative diseases such as ALS, or track the progress of regenerating axons, parts of neurons that send signals out to surrounding neurons.
"When studying how diseases affect the nervous system, you want to have a parts list of all the critical components in a system,” said Dr. Fiederling. “In the end, the better you know the system, the better you can fix it.”
###
This paper, “Tools for efficient analysis of neurons in a 3-D reference atlas of whole mouse spinal cord,” appeared on September 15 in Cell Reports Methods. The work was supported by NIH grants 1R21NS120665-01, 5U19NS104649 and DFG grant FI 2367/1-1. The authors declare no competing interests.